
 Basic Security Onion Overview
Security Onion Resources
- Security Onion Documentation
- https://readthedocs.org/projects/securityonion/downloads/pdf/2.3/
- Free essentials training/guide
- https://www.youtube.com/watch?v=5fxVaVO8-L8&list=PLljFlTO9rB155aYBjHw2InKkSMLuhWpxH&t=7s
- Different setups from node perspectives and different node types:
- https://docs.securityonion.net/en/2.3/architecture.html#architecture
- Distributed seems like the best route
- Hardware requirements: https://docs.securityonion.net/en/2.3/hardware.html
- MISP and Security Onion:
- https://docs.securityonion.net/en/2.3/misp.html
- Tools in SO:
- https://docs.securityonion.net/en/2.3/tools.html?highlight=tools
Primary Workflows:
- Alert Triage & Case Creation: Alerts, TheHive, Hunt
- Ad Hoc Hunting: Kibana, Hunt, TheHive
- Ad hoc: not planned in advance, but is done or formed only because a particular situation has made it necessary
- Detection Engineering: Playbook, Alerts, Hunt
In Security Onion 2, Logstash transports unparsed logs to Elasticsearch which then parses and stores those logs
PATHWAY USING FILEBEATS, LOGSTASH, REDIS, ELASTICSEARCH:
Filebeat sends logs directly to Logstash, which sends them to Redis for queuing. A second Logstash pipeline pulls the logs out of Redis and sends them to Elasticsearch, where they are parsed and indexed
Security Onion Tools
Elasitc Stack (ELK):
- Data ingestion is the process by which this raw data is parsed, normalized, and enriched before it is indexed in Elasticsearch #### ElasticSearch
full-text search and analytics engine
- allows you to store, search, and analyze big volumes of data quickly and in near real time for all types of data
- Raw data flows into Elasticsearch from a variety of sources, including logs, system metrics, and web applications → data integration → indexed into elastic search to be queried
- All of the data Elasticsearch collects is stored under /nsm/elasticsearch/ #### Logstash:
acts as an aggregator for multiple logging pipelines; Receives logs from Beats (FileBeats)
- Events aggregated and processed by Logstash go through three stages: collection, processing, and dispatching
- “Input” plugins for the data collection stage
- “Filter” plugins for the processing stage (enables the ability to enrich, manipulate, and process logs)
- “Output” plugins for the dispatching stage (push data to various locations, services, and technologies)
- handles the tasks of pulling and receiving the data from multiple systems, transforming it into a meaningful set of fields and eventually streaming the output to a defined destination for storage (stashing)
- turn your logs into easy-to-analyze structured log messages using filters for log enhancements
Kibana
data visualization and management tool; lets you visualize your Elasticsearch data and navigate the Elastic Stack using dashboards
- provides real-time visualization of Elasticsearch data as well as UIs for quickly accessing application performance monitoring (APM), logs, and infrastructure metrics data
- allows us to quickly analyze and pivot between all of the different data types generated by Security Onion through a “single pane of glass” (logs, alerts)
- Gives a good way to see how we categorize our data
![Desktop View]() ELK Filebeat Structure
ELK Filebeat StructureElastAlert
a simple framework for alerting on anomalies, spikes, or other patterns of interest from data in Elasticsearch.
- Used alongside with Kibana (Visualizing tool) to alert on inconsistencies in our data
- ElastAlert queries ElasticSearch and provides an alerting mechanism with multiple output types, such as Slack, Email, JIRA, OpsGenie, and many more.
SOC: Security Onion Console
Console that helps navigate the SO environment; Serves as an interface for tools integrated into SO that are used to analyze data
- PCAP: allows you to access your full packet capture retrieval that was recorded by Stenographer
- Hunt: Easier, more flexible way of sifting through data/network traffic/host traffic allows you to hunt through all of the data in Elasticsearch and is highly tuned for stacking, pivoting, data expansion, and data reduction
- Alerts: allows you to see all of your NIDS (Network Intrusion Detection System) and HIDS (Host-Based Intrusion Detection System) alerts
- Escalated alerts get a case created for itself in TheHive automatically
- Hunt interface integrated with Alerts (helps cast a wider net, Hunt gives all the data types for events while Alert just provides the Alert)
TheHive
Intrusion Response Platform (Tightly integrated with MISP (Malware Information Sharing Platform))
- Case Management Interface that makes dealing with security incidents that need to be investigated and acted upon swiftly easier to manage
- When using Alerts, Kibana, or Hunt, we may find alerts or logs that are interesting enough to send to TheHive and create a case to further investigate
- Escalated alerts get a case created for itself in TheHive automatically
CyberChef:
Encoding, encrypting and converting data formats
- simple, intuitive web app for carrying out all manner of “cyber” operations within a web browser
- enable both technical and non-technical analysts to manipulate data in complex ways without having to deal with complex tools or algorithms
- Decryption/Encryption, Generate/Analyze Hashes, Testing tool (penetration testing, forensics), compress/decompress data, translate data from character encodings, convert files between different formats, etc.
Playbook
tracks and monitors a specific situation, results from queries can be seen in hunt/kibana and if a query produces a high/critical level, an alert will generated on the alert interface
- Decryption/Encryption, Generate/Analyze Hashes, Testing tool (penetration testing, forensics), compress/decompress data, translate data from character encodings, convert files between different formats, etc.
- web application available for installation on Manager nodes
- allows you to create a Detection Playbook, which itself consists of individual Plays
- To create a play, based on sigma rules - a generic and open signature format that allows you to describe relevant log events in a straightforward manner
- provides a structured form in which researchers or analysts can describe their once developed detection methods and make them shareable with others
- Query is created based off ElastAlert/Elasticsearch configuration
- Key Components of a play:
- Objective & Context - what exactly are we trying to detect and why?
- The actual query needed to implement the Play’s objective. In our case, the ElastAlert / Elasticsearch configuration.
- What are the follow-up actions required to validate and/or remediate when results are seen? (next tasks)
- When a play is active, Elastalert rules created by Playbook will run every 3 minutes with 15 minute buffer time
Fleet
OSquery manager; enables programmable live queries, streaming logs, and effective management of osquery across servers, containers, and laptops
- Keep track of servers and containers wherever they live: on your own hardware, in Amazon/Azure/Google clouds, or a little bit of each
- useful for talking to multiple devices at the same time (query information for multiple devices)
Navigator
designed to provide basic navigation and annotation of ATT&CK matrice
- used to visualize your defensive coverage, your red/blue team planning, the frequency of detected techniques or anything else you want to do
- Uses MITRE ATT&CK Framework; created to document attacker tactics and techniques based on real-world observation
- a comprehensive matrix of tactics and techniques used by threat hunters, red teamers, and defenders to better classify attacks and assess an organization’s risk
- provides an appropriate level of categorization for adversary action and specific ways of defending against it
- ATTACK Matrix structure
- Tactics denoting short-term, tactical adversary goals during an attack (the columns)
- Techniques describing the means by which adversaries achieve tactical goals (the individual cells)
Wazuh
(endpoint detection): platform for threat detection, security monitoring, incident response and regulatory compliance
- Gain invaluable visibility from endpoint to your network’s exit point
- used to monitor endpoints, cloud services and containers, and to aggregate and analyze data from external sources
- Performs log analysis, file integrity, checking, policy monitoring, rootkit detection, real-time alerting and active response
- Security Onion utilizes Wazuh as a Host Intrusion Detection System (HIDS) on each of the Security Onion nodes
OSquery
uses basic SQL commands to leverage a relational data-model to query a system
- SO uses fleet to manage deployment of OSquery and send queries to devices OSquery is installed on
Beats
facilitates the shipping of endpoint logs to Security Onion’s Elastic Stack
- Filebeats for multiple log types, WindLogBeats for windows
Stenographer
a full-packet-capture utility for buffering packets to disk for intrusion detection and incident response purposes
- captures all the network traffic your Security Onion sensors see and stores as much of it as your storage solution will hold
- provides a high-performance implementation of NIC-to-disk packet writing, handles deleting those files as disk fills up, and provides methods for reading back specific sets of packets quickly and easily
Suricata
Network Threat Monitoring/Detection Engine
- Combines intrusion detection (IDS), intrusion prevention (IPS), network security monitoring (NSM) and PCAP (Packet Capture) processing to quickly identify, stop, and assess the attacks
- Suricata NIDS alerts can be found in Alerts, Hunt, and Kibana; Suricata metadata (protocol logs) can be found in Hunt and Kibana.
Zeek
Networking security monitoring tool
- monitors (sits and observes, not a firewall or intrusive prevention system) your network traffic and creates logs
- Logs are collected by Filebeat, parsed by and stored in Elasticsearch, and viewable in Hunt and Kibana
- interprets what it sees and creates compact, high-fidelity transaction logs, file content, and fully customized output, suitable for a more analyst-friendly tool like a security and information event management (SIEM) system
Strelka
real-time file scanning system used for threat hunting, threat detection, and incident response
- provides users with the ability to gain new insights into files on their host, network, or enterprise; While Strelka is not a detection engine itself, it can provide enough metadata in logs to identify suspicious or malicious files.
- purpose: perform file extraction and metadata collection at huge scale
- Zeek or Suricata (depending on set-up decision) will extract files from network traffic and then Strelka analyzes those files (file metadata) (placing them in /nsm/strelka/processed/); Strelka logs can be found in hunt and kibana
Salt
manages all processes on all nodes
- collects API traffic across your entire application landscape and makes use of AI/ML and a big data engine to discover all your APIs and their exposed data, stop attacks, and eliminate vulnerabilities at their source
- Discover all your APIs (automatically inventories in salt) and highlights where your APIs expose sensitive data,
- Pinpoints and stops attackers in real-time (correlates all activities back to a single entity)
- Improves API security posture: proactively identifies vulnerabilities in your APIs even before they serve production traffic
![Desktop View]() Example of Salt Control
Example of Salt ControlDocker
open platform for developing, shipping, and running applications with the use of containers
- Containers are a standardized unit of software that allows developers to isolate their app from its environment, solving the “it works on my machine” headache
- Containers are lightweight and contain everything needed to run the application, so you do not need to rely on what is currently installed on the host
- Benefits of Docker: Fast, consistent delivery of your applications, Responsive deployment and scaling, and Running more workloads on the same hardware
![Desktop View]()
Redis
in-memory data structure store, used as a database, cache and message broker
- Data structure server for developers to organize and use data efficiently and quickly; store vast amount of data in memory without the limitation of a relational database
- Key-Value NoSQL database; every data structure is represented/accessed by a key
- On Standalone and distributed deployments, Logstash on the manager node outputs to Redis. Search nodes can then consume from Redis
![Desktop View]()
Filebeat (Client end)
log/file shipper; a lightweight way to forward and centralize logs and files
- Collects logs from the file systems and sends them to logstash (evaluation installation sends them to elasticsearch)
- monitors the log files or locations that you specify, collects log events, and forwards them either to Elasticsearch or Logstash for indexing
Curator
Curates, or manages, your Elasticsearch indices and snapshots (prunes back to Elasticsearch)
- A few thing curator does (along with more):
- Add/Remove indices from alias
- Create new index
- Close/Delete indices
- Open closed indices
- Take a snapshot (backup) of indices
- Restore/Delete screenshots
Grafana
Interface for seeing system health information
- Helps visualize the performance of our system
- monitor technical state of software systems we use internally or build for our customers
Syslog
System Logging Protocol
- monitor technical state of software systems we use internally or build for our customers
- Standard protocol used to send system log or event messages to a specific server
- primarily used to collect various device logs from several different machines in a central location for monitoring and review
Lucene
Apache Lucene - Query Parser Syntax
- Used by Onion Query Language (OQL) in Hunt
Architecture Notes
Resources
- https://docs.securityonion.net/en/2.3/architecture.html
- https://docs.securityonion.net/en/2.3/hardware.html
Manager Node
Manages the entire distributed deployment
- SOC (Security Onion Console) tools: Grafana, TheHive, Hunt, Kibana, Fleet, CyberChef, Playbook, ATT&CK navigator
- Other Components: Elasticsearch, Logstash, Curator, Elastalert, Redis, Wazah
- Hosts all the different tools that analysts will use to monitor their networks
- Get alert data back from sensors
- Runs own copy of Elasticsearch which manages cross-cluster search configuration (includes configuration for search nodes)
- Hardware Requirements (Distributed)
- CPU: Receives incoming events and places them into Redis (cache memory), runs all frontend web components, and aggregates search results across all the search node Elasticsearch instances. 8 CPU cores recommended.
- RAM: Used for Logstash, Elasticsearch, and disk cache for Lucene. The amount of available RAM will directly impact search speeds and reliability. 16-128GB recommended
- Disk Space: Used for storage of indexed metadata. A larger amount of storage allows for a longer retention period. It is typically recommended to retain no more than 30 days of hot ES indices. Several terabytes are recommended
An analyst connects to the manager node from a client workstation (typically a Security Onion virtual machine installation) to execute queries and retrieve data
Search Node
Responsible for parsing, decorating, indexing, and storing logs from the different datasets; processes the queries sent from the manager node
- Components: Elasticsearch, Logstash, Curator, Wazuh
- Extends the storage and processing capabilities of the manager node; added to the manager node’s cluster search configuration so that data that resides on these nodes can be queried from the manager node
- Implements Elasticsearch’s cross cluster search
- Pull logs from Redis queue on manager node and then parses/indexes those logs; when user queries manager node, manager node queries search nodes and then returns results
- Hardware Requirments
- CPU: Used to parse and index incoming events; events and data consumption increases = more CPU required
- RAM: Used for logstash, Elasticsearch, and disk cache for Lucene; amount of available RAM will impact search speeds and reliability
- Disk: Used for storage of indexed metadata; larger amount of storage = longer retention period if desired
- One NIC is needed for management
Manager + Search Node
Both a manager node and search node
- Components: Elasticsearch, Logstash, Kibana, Curator, ElastAlert, Redis, Wazuh
- Since it is parsing, indexing, and searching data, requires higher hardware requirements than a normal manager
- Stores logs from itself and forward nodes; also acts as a syslog destination for other log sources to be indexed into Elasticsearch
- Hardware
- CPU: Used to parse and index incoming events; events and data consumption increases = more CPU required
- RAM: Used for logstash, Elasticsearch, and disk cache for Lucene; amount of available RAM will impact search speeds and reliability
- Disk: Used for storage of indexed metadata; larger amount of storage = longer retention period if desired
Sensor Node
Runs sensor components only; forwards all metadata and logs (via filebeats to logstash) to the manager node where they are stored in Elasticsearch on either a manager or search node
- PCAP stays local to the sensor and is accessed through use of an agent
- CPU: used for analyzing and storing network traffic; as monitored bandwidth increases, greater amount of CPU will be required
- RAM: Used for write cache and processing traffic
- Disk: used for storage of PCAP and metadata; larger amount of storage = longer retention time if desired
Log Ingest
Manager Node
Core Pipeline: Filebeat [Fleet Forward] –> Logstash [Manager] –> ES Ingest [S] - Logs: Zeek, Suricata, Wazuh, Osquery/Fleet, syslog
Search Node
- Pipeline: Redis [Manager] –> Logstash [Search] –> ES Ingest [Search]
- Logs: Zeek, Suricata, Wazuh, Osquery/Fleet, syslog
Forward Node
Pipeline: Filebeat [Forward] –> Logstash [M M+S] –> ES Ingest [S M+S] - Logs: Zeek, Suricata, Wazuh, syslog
Manager + Search Node
Core Pipeline: Filebeat [Fleet Forward] –> Logstash [M+S] –> ES Ingest [M+S] - Logs: Zeek, Suricata, Wazuh, Osquery/Fleet, syslog
 ELK Filebeat Structure
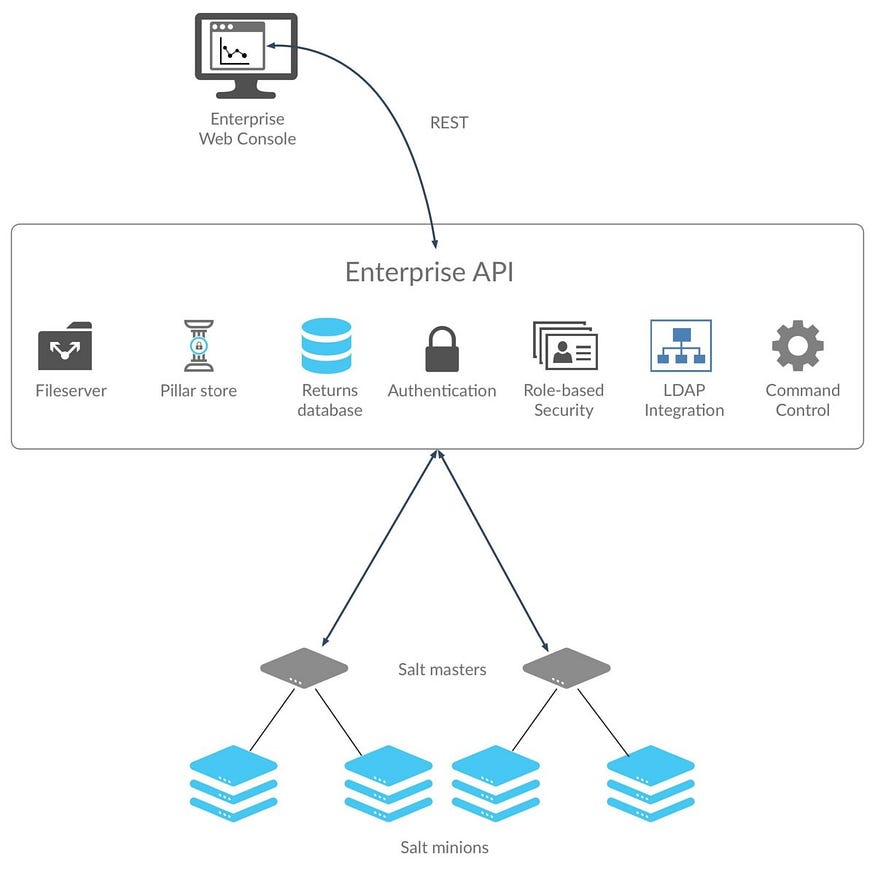 Example of Salt Control
